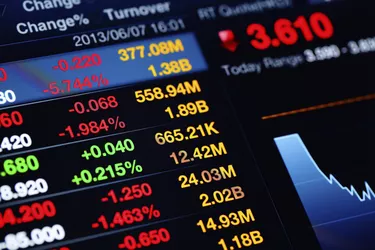
After price, volume is one of the most commonly quoted data points related to the stock market. Reflecting the overall activity in a stock or market, volume is the business of the market itself: the buying and selling of shares. As such, volume is an important indicator for traders in analyzing market activity and planning strategy.
Number of Shares Traded
Video of the Day
Volume is a measure of market liquidity based on the number of shares that are traded over a given period. Volume data is recorded for individual stocks, their related options chains and for indices as a whole. Normal volume for each of these exists as a range, with spikes or dips significantly higher or lower being regarded as an important indicator. Volume is usually lowest around holidays and shortened trading sessions.
Video of the Day
Displaying Data
On most stock charts, volume is displayed horizontally as a histogram beneath price data. Large, commonly traded blue-chip names typically trade in the tens of millions of shares per day; indices can easily several billion shares changing hands in a single session. Smaller, illiquid stocks frequently only measure in the tens of thousands or less. On most trading platforms, and on the floor of exchanges, daily volume is simply represented by the corresponding digits.
Market Insight
In addition to normal volume measurements, traders also look at volume-by-price, which is usually displayed as a vertical histogram. This type of chart shows the number of shares trading at various price increments, providing insight into the support and resistance levels that tend to trigger the most buying or selling. Combining price and volume into a single chart, volume-by-price is a powerful indicator that illustrates how professionals use internal market data to plan profitable trades.
Supply and Demand
Volume reflects the supply and demand for stocks. A stock with low volume is said to be illiquid, which presents certain risks and opportunities. When volume is low, the spread between what buyers are willing to pay and what sellers are asking to take will increase, making successful trades more difficult to make. As a result, selling an illiquid stock quickly can be difficult or impossible without accepting the lower bid price. Also, because the spread is wide, illiquid stocks are given to large price fluctuations in either direction when they do trade.
Trading Decisions
Traders frequently look to volume in determining the conviction of a move in stocks. Remembering that price is only an indication of the last trade, the transaction of a single share can move a stock. But movement on low volume suggests an aberration that is not likely to be sustained. Larger than normal volume, on the other hand, is evidence that traders are confident about the direction of the stock's movement and are willing to put money on the line.